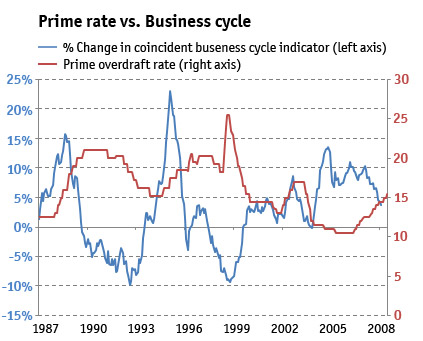
The tighter interest rate environment already commenced in June 2006 when CPIX inflation jumped from 3,7% in April to 4,8% in June 2006. Two years ago, the expectation was that the upward interest rate phase could last for about 18 to 24 months, and that prime interest rates would peak at around 13 or 14%. However, the runaway oil price which squeezed costs all around and even caused a sharp increase in global food prices, necessitated an ongoing revision in forecasts and expectations about when interest rates would peak and at what level.
Of course most of the inflationary pressures during the next couple of months will still come from escalating food and oil prices, and it is impossible to tell when and where these prices will start to subside. Therefore a further 50 basis point increase in interest rates appears all but certain. But if oil and food prices should start to stabilise within the next two to three months, there seems to be at least a possibility that rates could peak in the third and fourth quarter of this year and that they might then start to decline by early 2009.
| Upward interest rate cycles in SA since 1960 | ||||
| Years | Duration of upward move (months) | Duration of upward move and peak (months) | Total percentage point rise | Number of months per 1% rise |
| 1960 - 1961 | 10 | 17 | 1.00 | 10.0 |
| 1964 - 1968 | 26 | 45 | 2.50 | 10.4 |
| 1970 -1972 | 9 | 23 | 1.00 | 9.0 |
| 1973 - 1978 | 32 | 57 | 5.00 | 6.4 |
| 1981 -1982 | 15 | 22 | 10.50 | 1.4 |
| 1983 - 1985 | 20 | 23 | 11.00 | 1.8 |
| 1987 - 1991 | 34 | 51 | 9.00 | 3.8 |
| 1994 - 1997 | 27 | 37 | 5.00 | 5.4 |
| 1998 | 3 | 4 | 7.25 | 0.4 |
| 2001 - 2003 | 9 | 17 | 4.00 | 2.3 |
| Average since 1960 | 18.5 | 29.6 | 5.63 | 5.1 |
| Average since 1980 | 18.0 | 25.7 | 7.79 | 2.5 |
| 2006 - 2008 (forecast) | 27 | 32 | 5.50 | 4.9 |
Table 1: Upward interest rate cycles in SA since 1960
How would such an upward rate cycle compare with previous ones? From the table it can be seen that should this scenario unfolds, the current upward move of the interest rate cycle would have lasted for 27 months, and would be much longer than the average upward move in interest rates experienced since 1960 (i.e. 18,5 months). In fact it will be of equal length to the 1994-97 upward phase. Any further increases in interest rates beyond the expected 16% will make this upward phase similar in length to the 1973-1978 cycle (32 months) or even to the longest upward phase of the past fifty years — the 1987-1991 period when interest rates were increased for a period of 34 months. If interest rates indeed start to come down in February 2009, the upward phase and peak would have lasted for 32 months, which would also be longer than the average upward move and peak experienced since 1960. During 1973-78 however, this upward move and peak lasted for no less than 57 months, while the 1987-1991 upward phase and peak lasted 51 months. Unless interest rates move up much further beyond 16%, the total upward move of 550 basis points would be comparable to the average upward move experienced since 1970, but it will still be considerably less than the average increase of 780 basis points increase since 1980. The speed of the current tightening phase would also be similar to the average tightening phase since 1960, with roughly 5 months lapsing, on average, for every 100 basis points interest rate increase.


