Background
According to the efficient-markets hypothesis (EMH), financial markets are "informationally efficient". Therefore, prices on traded assets such as stocks and bonds, reflect all known information, and it is consequently impossible to consistently outperform the market by using any information that the market already knows, except through luck. Information or news in the EMH is defined as anything that may affect prices that is unknowable in the present and thus appears randomly in the future.
Many investors and researchers have disputed the efficient markets hypothesis on both empirical and theoretical grounds. Behavioural economists attribute the imperfections in financial markets to a combination of cognitive biases such as overconfidence, overreaction, representative bias, information bias, an inability to use non-linear reasoning, and various other errors in reasoning and information processing.
The EMH also does not try to answer the question of whether investors in general have a good idea of the fate that awaits the real economy, and if so, if their stock trading activity will reflect this. In short: Is the stock market in any sense a predictor of future economic activity as measured by the real gross domestic product (GDP) growth? This question is especially pertinent in the current environment, with many analysts and economists fearing another "Great Depression" in the USA and other developed economies, while others believe that the recessionary conditions will start to dissipate towards the end of 2009 and into 2010. The drop in stock market prices had been quite severe in the final quarter of 2008, but towards the end of the first quarter of 2009, markets have shown some tentative signs of recovery. What implications are there then for the economies, if any?
The question of whether the stock market can predict the economy has been widely debated. Those who support the market's predictive ability argue that the stock market is forward-looking, and current prices reflect the future earnings potential, or profitability, of companies. Since stock prices reflect expectations about profitability and since profitability is directly linked to economic activity, fluctuations in stock prices are thought to lead the direction of the economy. If the economy is expected to enter into a recession, for example, the stock market will anticipate this by bidding down the prices of stocks.
The "wealth effect" is also regarded as support for the stock market's predictive ability. Pearce (1983) argues that since fluctuations in stock prices have a direct effect on aggregate spending, the economy can be predicted from the stock market. When the stock market is rising, investors' wealth increase and they spend more. As a result, the economy expands. On the other hand, if stock prices are declining, investors experience a decrease in wealth levels and spend less. This results in slower economic growth.
Problem statement and method of analysis
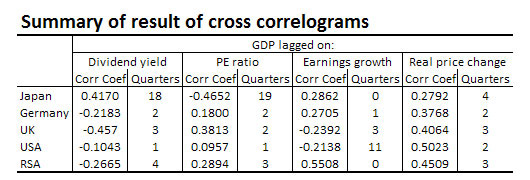
Data for the past three and a half decades were used to determine whether there had been any statistically significant relationship between the stock market and real GDP growth. The number of periods (quarters) into the future that this relationship appeared to be the strongest, was also determined. A number of stock market indicators were correlated with the GDP to ascertain which one had the best predictive power. Finally, apart from the South African experience, these correlations in other markets were also measured. These markets included the USA, UK, Germany and Japan.
IMF quarterly data for real GDP in local currencies were used. Inflation rates were approximated by the GDP deflators, and share prices were deflated by these series to obtain share prices in real terms. Stock market data were obtained from the various bourses, and earnings growth indices were calculated from PE-ratios and price index data. Al these series were averaged to quarterly data.
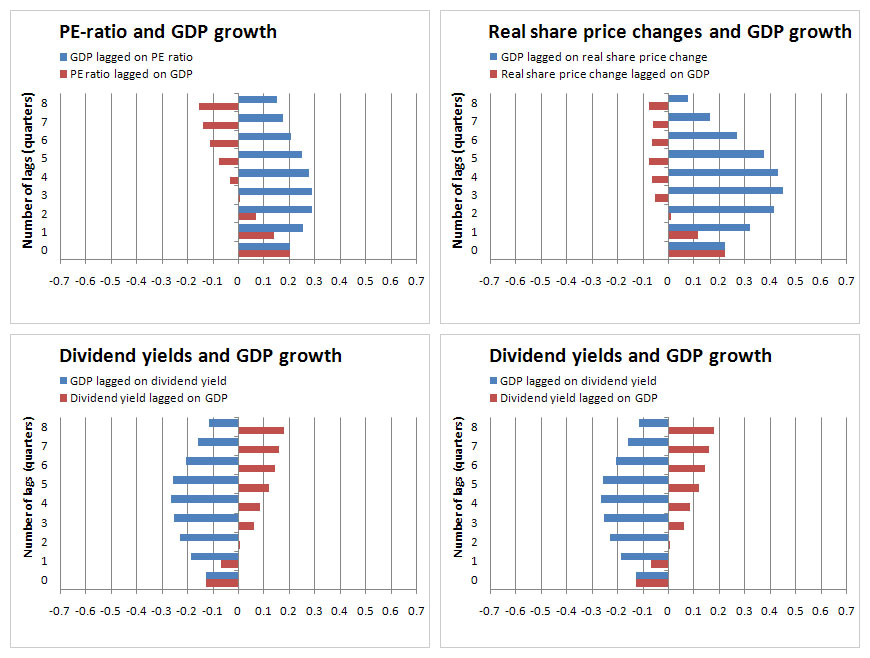
Cross-correlation matrices were compiled for each of the following stock market variables and the GDP growth numbers, for the period 1Q1973 to 4Q2008:
- PE-ratio
- Dividend yield
- Year-on-year change in real stock price index
- Year-on-year change in nominal earnings growth index
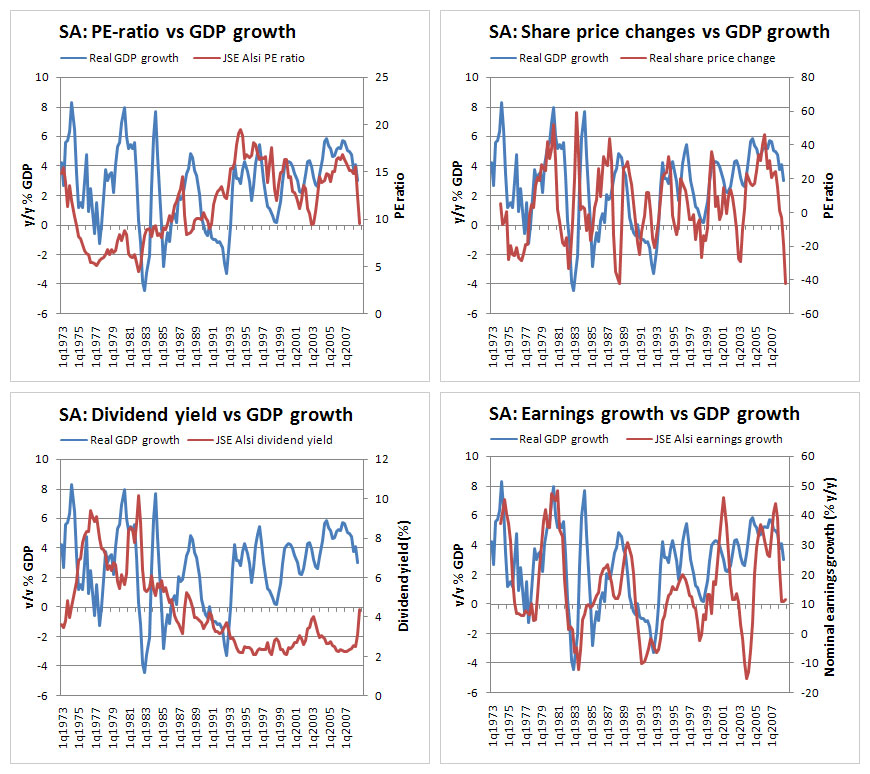
For South Africa, these four variables were plotted together with the real GDP growth rates, and are shown in figure 1.
Casual observation of the plots does not reveal a lot of information about the strength of correlation between the data series pairs or lag structures involved. However, in some of the graphs it would appear that peaks and bottoms in the equity market were followed by similar peaks and bottoms in economic growth.


